Ruport: Ruby Reports
A simple, extensible reporting system built for Rubyists
Examples
Though the ruport package includes a number of more in depth sample applications, here a few basic examples and sample reports to give you an idea of how Ruport works.
Basic Grouping of CSV data
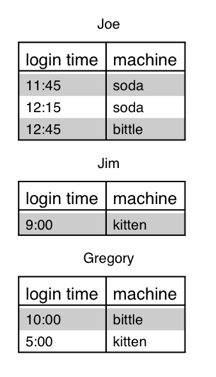
Say you want to load in a CSV from file and group it by people's names, and get a PDF report back. This is easy in Ruport.
Below is some sample data: (foo.csv)
  name,login time,machine
  Gregory,10:00,bittle
  Joe,11:45,soda
  Jim,9:00,kitten
  Joe,12:15,soda
  Gregory,5:00,kitten
  Joe,12:45,bittle
To do the report we mentioned before, we'd just do something like this:
  t = Table("foo.csv")
  grouping = Grouping(t,:by => "name")
  puts grouping.to_pdf
Directing the output of that script to a file results in nice output like this:
There are actually several styles for output, and also, it's trivial to do HTML, Text, or CSV formatted output as well.
A trivial dump of an ActiveRecord model to CSV
If you're looking to just grab a CSV dump of some model in your Rails app, Ruport might be the easiest way to do it. Just add require "ruport" in your environment.rb file, and then the following code to your model:
  class MyModel < ActiveRecord::Base
    acts_as_reportable
  end
If you want a full dump, just do this:
puts MyModel.report_table.to_csv
If you want to reduce via an AR find, you can pass along any of those options as well.
puts MyModel.report_table(:all, :conditions => ["name = ?", "gregory"]).to_csv
Ruport can do a whole lot more tricks with ActiveRecord / Rails, including handle all types of associations and model methods. For details, see Acts As Reportable.
SVG Graphs with ruport-util
If you're using the ruport-util package, it's very easy to generate beautiful SVG graphs. The functionality is still a bit basic, but for the most common needs, the output is quite nice (Thanks to Scruffy!)
Here is a trivial graphing example:
  require "rubygems"
  require "ruport"

  require "ruport/util"

  class GraphReport < Ruport::Report

    renders_as_graph

    def renderable_data(format)
      graph = Graph(%w[a b c d e])
      graph.series [1,2,3,4,5], "foo"
      graph.series [11,22,70,2,19], "bar"
      return graph
    end

  end

  GraphReport.generate do |r|
    r.save_as("foo.svg", :template => :graph)
  end
The output ends up looking something like this:

Of course, if you need to display this easily in a browser, you might want to convert it to another format such as PNG or JPG. You can do this by simply changing the extension of your output filename, so long as you have Gruff installed.
Enough Flashy Examples for Now
Hopefully we've at least sold you on the idea of using Ruby Reports for your project. Still, we'd like to take this chance to remind you that the real gains you'll see from Ruport are not at this high of a level, but rather deeper in the trenches. We're aiming to provide a super light weight foundation to build reporting apps on top of, because we feel that's what Rubyists will best benefit from. Hopefully, you'll find that to be true for your work.
If you're convinced and ready to give Ruport a spin, have a look at some of the available resources, and then come say hello on the Ruport mailing list.
Happy Hacking!